Why do we need computers to help us in sport?
Our ‘Goal’
We predicted that the homemade system would be accurate as regards sensor/photographic capacity, but that analysis ‘after-the-score’ would take time, and thus will not be as prompt as modern, sophisticated systems.
We were confident that we would be able to analyse, investigate and measure results accurately, and we would analyse data to evaluate whether use of the PIR Motion Alarm GPIO Project Kit for Raspberry Pi is the most accurate way to design and make a homemade Hawkeye system.
How did we complete our project?
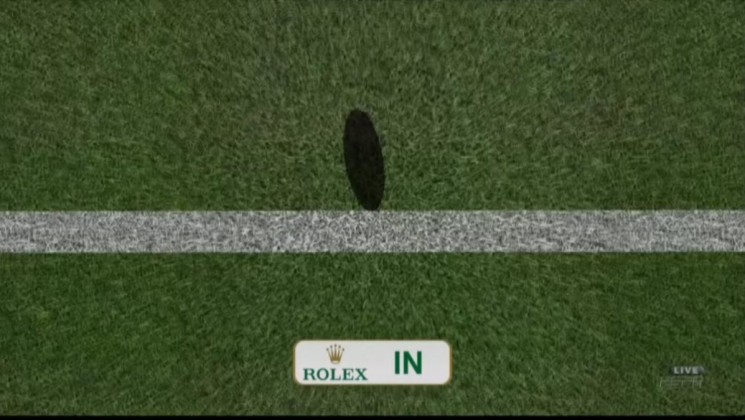
- We observed various sensors and high performance cameras. We referenced use of such technologies in sports we love, with a particular focus on the importance of Hawkeye in this year’s All Ireland Hurling Final
- We designed and made a practical prototype ‘homemade Hawkeye’ system to capture images from our Raspberry Pi camera module that will email a photo of a score/miss to our iPad and saves a 10 second HD video to memory card.
- We created a fair-test system using a set procedures mechanism, to be overseen by the
touchline referee who will relate data – as secured from the system – to the pitch referee. - We measured and recorded scores/misses using excel sheets and database technologies.
- We altered the test by ensuring that we tested the system in various weather conditions, times of day, for use in different sports, etc. We compared, contrasted and evaluated the use of the system for various sports.
- We analysed whether we can confidently advise our students to use our system when they play the teachers in June 2015.
How did we present our Data?
- We fully familiarised ourselves with the use of Raspberry Pi systems, and related it to our understanding of programming to date.
- We interviewed an expert on Croke Park technology systems to explain how Hawkeye has been integrated into match days in Croke Park.
- We used Google Sketch-Up to draw what we think our system will look like at the goal line.
- We plotted the trajectory of shots and analysed angles that will help us to improve our accuracy when playing.
- We predicted patterns of accuracy using Excel, bar charts, pie-charts and line-graphs, and we will also use such graphs to display our results for analysis.
- We used infographics when ‘selling’ the system to our classmates (‘the market’).
- Our stand at the Science Fair has interactive and static elements, with a model of our system on show.
- We are using various mobile technologies to present our data.
- We tweeted (@StPetersBray) and blogged (www.stpetersbrayblog.com) about our Science Fair journey in advance of the display day, and shared our successes, failures and learning ‘moments’ with other schools, sourcing as much expertise as possible online.